ACY Market Analyst

ACYaustralia

New member
ACY Market Analyst on 9 June
Pound Collapses After Inconclusive UK Election Results

The pound tumbled the most since October and hit the low since April 18. Sterling dropped 1.83 percent to $1.2695 as of 10:00 a.m. in Sydney, after the release of the initial UK exit poll inconclusive U.K. election result. A huge volatility is caused by political uncertainty of narrowing polls, which the ruling Conservative Party was projected to win most seats, though fall short of an overall majority, according to an exit poll.
The election results cap today’s major events that catch investors most attention all week, raising the possibilities of political turmoil in the next round less than a year after Britain voted to leave the European Union. Initial U.K. election exit poll statistics show that Conservative Party won 314 seats, Labour Party 266 seats, SNP 34 seats and Liberal Democrats 14 seats. With polls narrowing, Primer Minister Therasa May didn’t have a guarantee to win the election.


https://www.facebook.com/notes/acy-...clusive-uk-election-results/1941120589497941/
 
Oil Rally Above $46 as Supply Glut Eases – 13 June, ACY Team
West Texas Intermediate had a second straight day with a climb of 0.56 percent to settle at $45.894 a barrel on the New York Mercantile Exchange, paring gains from as high as $46.595 during the session yesterday on June 12.
Recent rebound occurred after Saudi Energy Minister Khalid Al-Falih said inventories are declining and reductions will accelerate in the next three to four months. The soaring U.S. stockpiles may be a major reason that gains in these two days did not erase the 3.8 percent loss last week.
Crude keeps trading below $50 a barrel amid investor’s concern over increased U.S. crude supplies will limit its further price rise, which is an action to counter production curbs by the Organization of Petroleum Exporting Countries and allies including Russia. American explorers added oil rigs for the 21st straight week to the record high since April 2015, a statistic from Baker Hughes Inc. Output at major U.S. shale plays will reach a record 5.48 million barrels a day in July, according to the Energy Information Administration.
After OPEC’s deal to limit output in attempt to push prices failed to impress investors as it didn’t include deeper cuts, some alternative or exit plans, all focus turned to what’s happening in the U.S. market. There’s still a bearish outlook for crude oil in the long term before a potential agreement could be reached between OPEC and U.S. or some further effective plans could be put forward by OPEC.
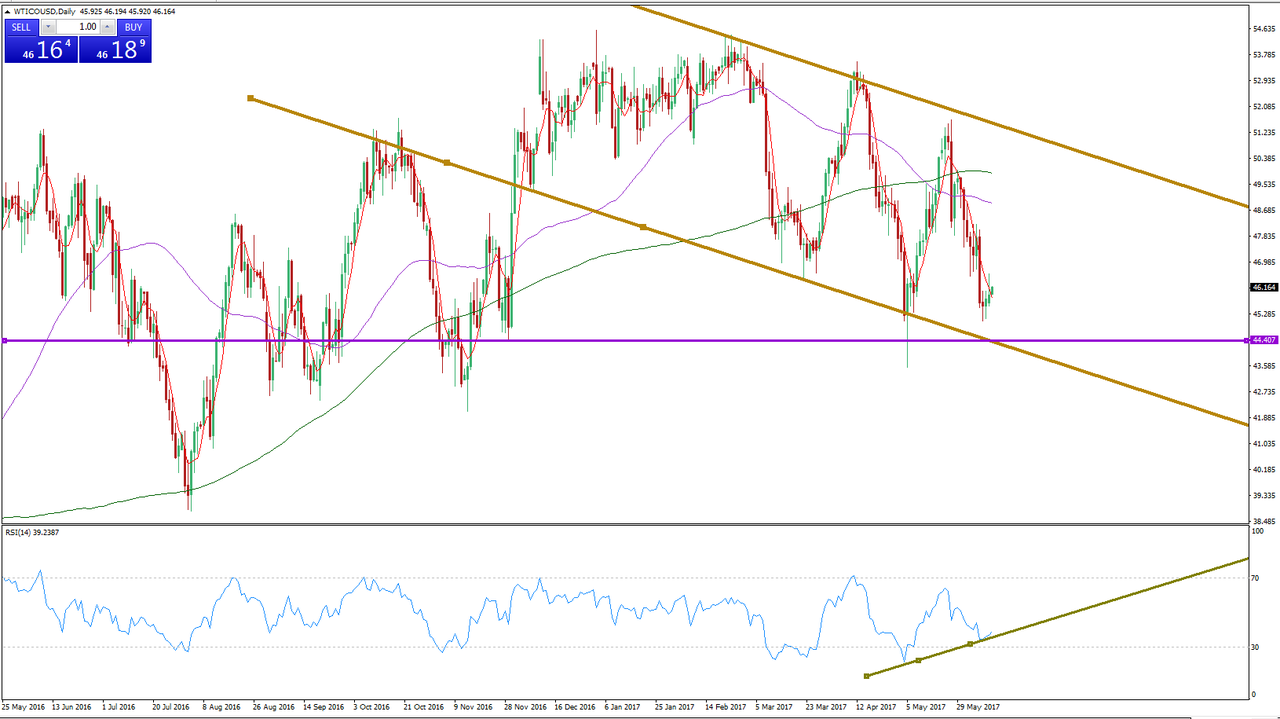
Technically oil prices has some rebound rather than breaking the descending price channel against the U.S. dollar, hinting that a bottom may be in place near the lower channel line and prices likely continue to trade in this channel.
Near-term outlook for crude turns to constructive as price & the Relative Strength Index (RSI) run the bullish trends carried over from early May. In the event that the oil rebounds further, traders should first watch for a resistance found at 60-day moving average. Alternatively if prices fail to rally and reverse lower to break the lower channel, a support could be found at November 29’s low of 44.407.
9772119_20170613010003.png


Chart 1: WTICOUSD Daily


For the details, please visit our Facebook page:


ACY, the Best Choice for Global Investors
We can Improve your Trading!

For more information, please visit us on www.acy.com
https://www.facebook.com/acy.capital/
 
Oil Slump to Six-month Lows on Glut Fears - 21 June, ACY Team

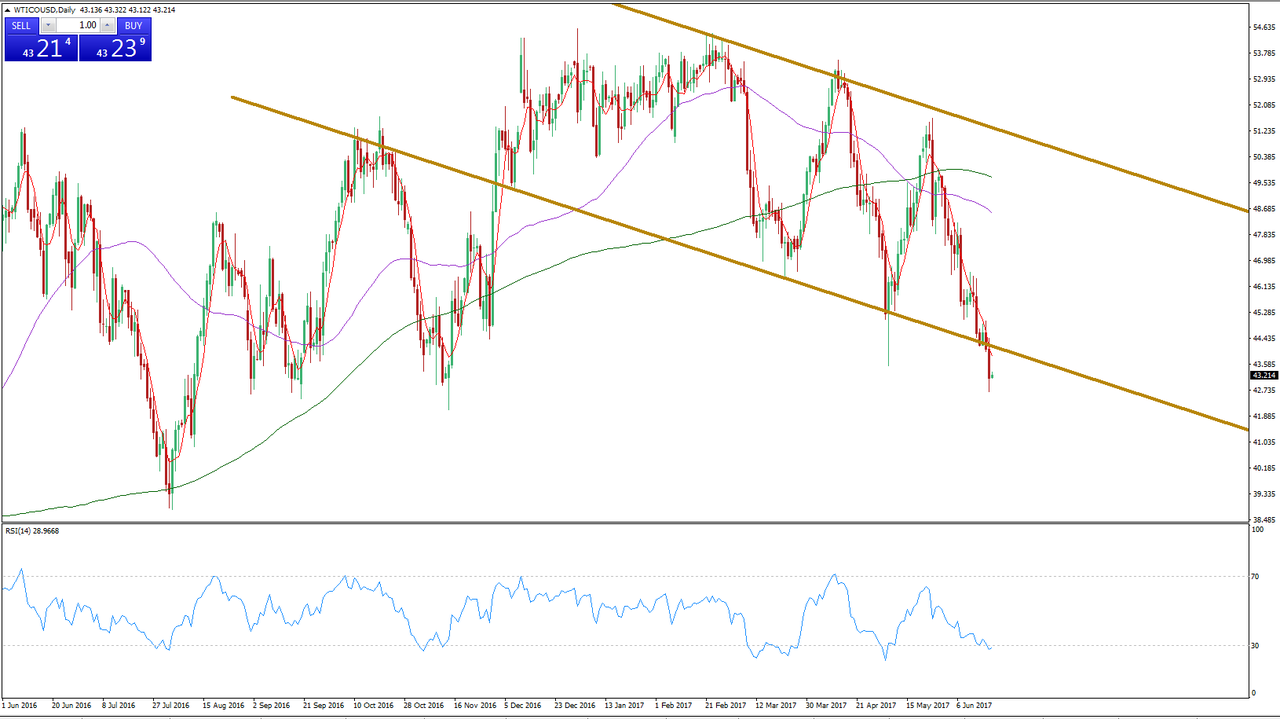
Crude fell more than 2.2 percent on Tuesday, settling at $43.104 per barrel, the lowest level since November, amid increased supply from several key producers which undermined the efforts of high compliance by OPEC and non-OPEC oil producers with a deal to curb oil outputs.
Oil prices’ breakout of the descending channel yesterday increases the possibility of further decline, to its lowest settlement since Nov. 15, two weeks before the Petroleum Exporting Countries and other producers made a cut deal by 1.8 million barrels per day (bpd) for six months from January.
"Given the expectation that you'll see higher production levels in several areas of the world, it's going to offset all they're taking off the market," said Gene McGillian, manager of market research at Tradition Energy.
The descending momentum, seems continue even though OPEC, Russia and some other producers extended limits on output until the end of March 2018. Oil supplies jumped in May as output recovered in OPEC such as Libya and Nigeria, in addition to increased U.S. oil output, both partially exempt from the production reduction agreement.
Libya's oil production rose more than 50,000 bpd to 885,000 bpd after the state oil company settled a dispute with Germany's Wintershall. Meanwhile Nigerian oil supply is also rising. Exports of Nigeria's Bonny Light crude are set to reach 226,000 bpd in August, up from 164,000 bpd in July.
Ahead of weekly U.S. inventory reports, U.S. crude oil stocks were forecast to have fallen 2.1 million barrels last week, while gasoline was seen building by 400,000 barrels after last week's data showed an unexpected build that weighed heavily on the market.
Technically oil prices already broke lower to the downward channel with also hitting six-week lows against the U.S. dollar, giving a sign that it may keep the momentum in bearish market. Near-term outlook is not encouraging as price & the Relative Strength Index (RSI) is running in pessimism unless some rebound in a few days back to the channel. In the event that the oil continues to decline, traders may look for adding more in a short position to follow the momentum. Alternatively if prices fail to drop further and reverse to rally, traders may look forward to chasing some rebound on a long position.

9772119_20170621034923.png


Chart 1: WTICOUSD Daily


For the details, please visit our Facebook page:


ACY, the Best Choice for Global Investors
We can Improve your Trading!

For more information, please visit us on www.acy.com
https://www.facebook.com/acy.capital/
 
Gold Prices Find Support After a Dramatic Loss – 22 June, ACY Team

Gold halted its descending momentum on Wednesday after ten consecutive days of sharp slide, closing with slight gains of 0.21 percent at 1245.47 points. Recent decline was mainly caused by Fed’s officials’ saying that the rate hike plan is still on the way, a hawkish voice pushing U.S. stocks while curbing Gold prices.
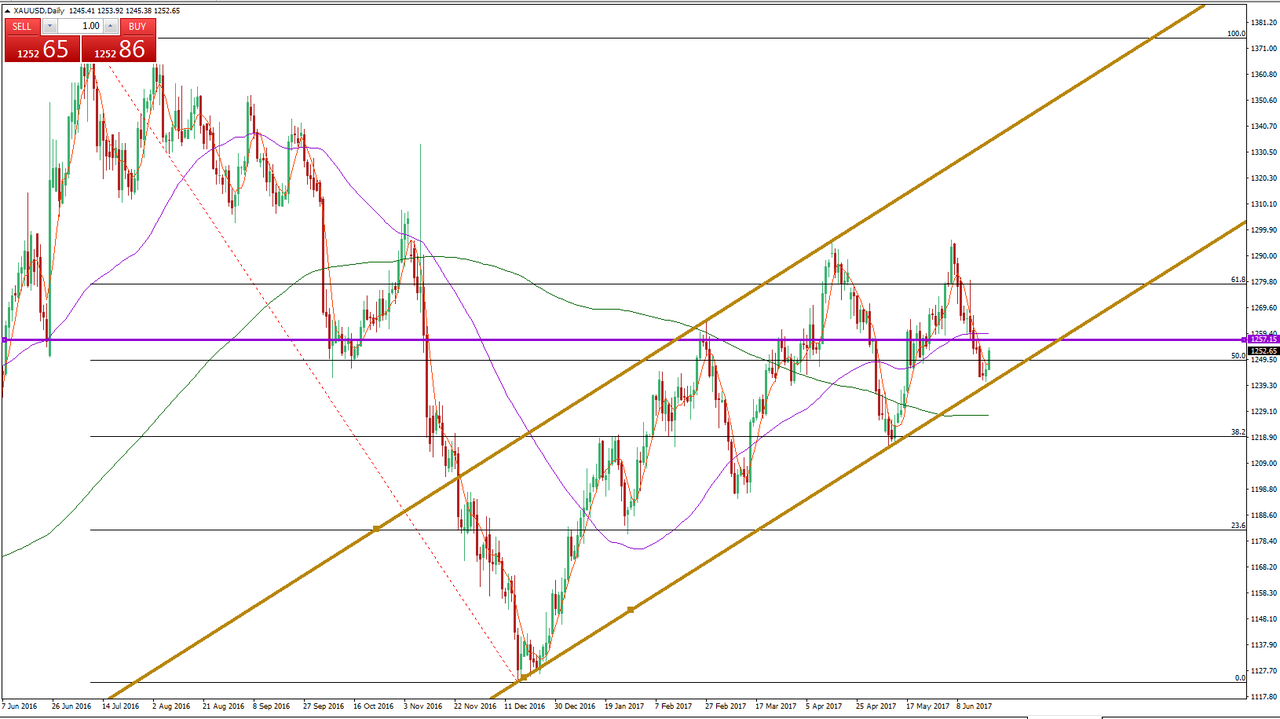
The gold gains significantly for a second straight day to 1252.12 points as of 11:20 a.m. in Sydney, showing a reversal near a daily support level found at the lower ascending channel line. Although it is rebounding mainly caused by a technical support, the mid-term outlook for Gold prices is not encouraging as the U.S. economic data is not delightful to long investors for gold.
Consumer prices in the United States increased 1.9 percent year-on-year in May of 2017, easing from a 2.2 percent rise in April and below expectations of 2 percent. It is the lowest inflation rate since November last year. Interest rate was announced to be revised up to 1.25 percent, 0.25 percent higher than previous, attracting more funds into bank sectors and securities, instead of into the gold market. From macroeconomic perspective, lower-than-expected inflation level and the proceeding rate hike plan are hampering its rally in a recent few weeks.
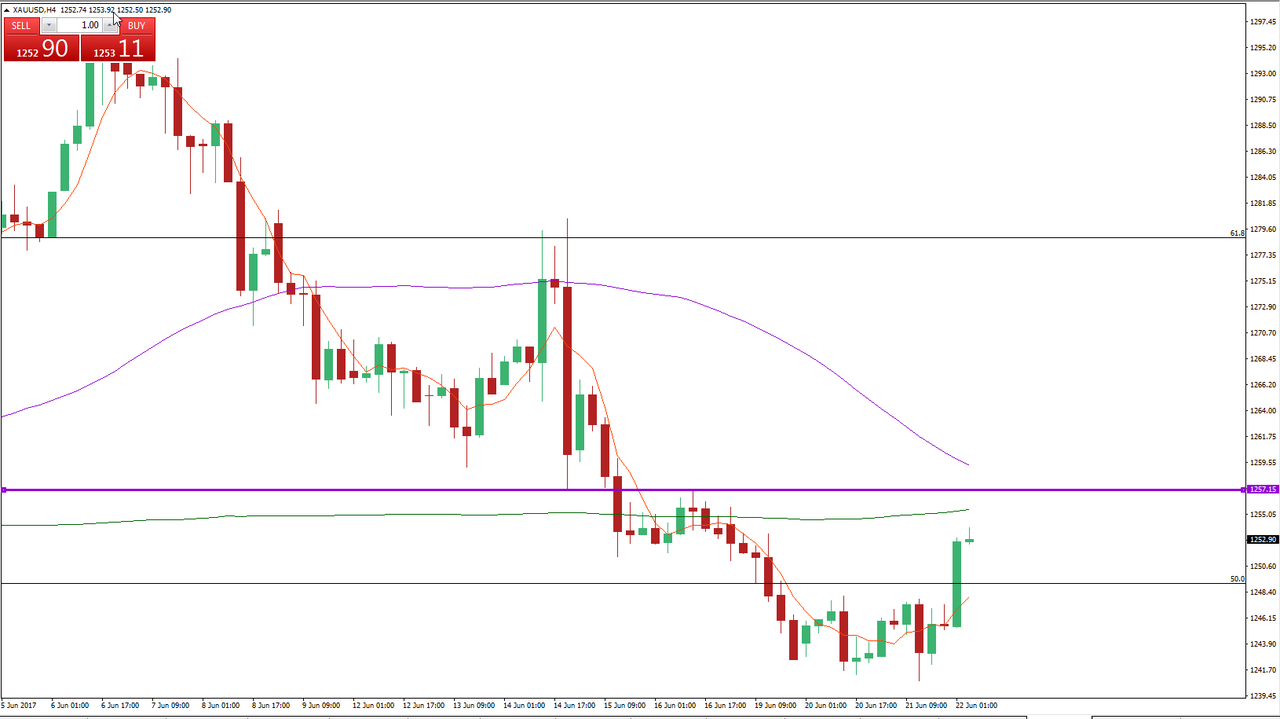
Technically the 4-hour chart shows a breakout of a key resistance level around $1249, which is very near the 50% Fibonacci retracement of the July-December 2016 major move, after the continued sell-off in Gold prices. A surge of the breakout move changes the short-term pessimism and may fuel massive confidence to investors who are looking for a long position. If it is not retreat to 50% retracement level, a higher resistance level could be identified at $1257.15.

9772119_20170622022200.png

Chat 1: XAUUSD H4
Given the bullish nature of the long-term setup, the Gold prices are rebounding after finding a support of the ascending channel line, and traders would likely want to incorporate the example of short-term support for making a long position. With price action did not move outside the long-term ascending channel, it more likely continues to swing in it.

9772119_20170622022149.png


Chart 2: XAUUSD Daily

For the details, please visit our website www.acy.com

ACY, the Best Choice for Global Investors
We can Improve your Trading!

For more information, please visit us on www.acy.com
https://www.facebook.com/acy.capital/
 
Loonie Keeps Ascending Momentum With Strong Retail – 23 June, ACY Team

The loonie rose 0.71 percent to C$1.32332 against the U.S. dollar, approaching the session highs since March. Its strength caught many investors by surprise given the drop in Oil prices to the lowest levels since August this week, which is seen as one of the major drivers in the economy.
The continuous appreciation of the Canadian dollar was brought about by a double-punch of hawkishness from Bank of Canada members Wilkins that was stamped by Governor Poloz who said that prior rate cuts had fuelled economic growth in terms of an Oil crash.
Recent growing value of CAD was also triggered by better-than-expected retail sales released on Thursday, the strongest start since 1991 showing a confirmation of a stable and growing Canadian economy. This figure highlights how much consumers—buoyed by strong employment growth—have powered the nation’s economy out of an oil slump, generating growth that is among the highest in the developed world. Increased investors, however, show angsts over the growth may not be sustainable as most of the consumer spending is driven by the wealth effects from a surging real estate market, especially in Vancouver.
As Poloz said, the economy is gathering moment, not only in some certain spots but across a much wider array. Investors need to keep a close eye on the upcoming CPI data on Friday, which is forecasted to be 1.5 percent, slightly lower than previous. If CPI is set to be higher, it could put pressure on the Bank of Canada to raise rates, an action that leads to stronger CAD.
The hourly technical chart shows that there are two key supports in the level of 1.31905, the June 19th’s lows and 1.34641, the June 14th’s lows. In the event that the USD/CAD breaks lower, traders should first watch for the pair to breakout beneath those two lows. Alternatively if prices reverse higher pulled by supports, traders may look for a long position in the near term.

ZHpFFH

Chart 1: USDCAD H1

The USD/CAD is consolidating in a developing ascending weekly price channel. With touching the lower channel line, it likely rebounds with a technical support and keeps moving in the channel. However, if it succeeds to break lower continuous CAD gains could occur which attracts more investors to buy loonies for more profits.

yZmYhF

Chart 2: USDCAD W1

Retail trader data reveals 68.4 percent of traders are net-long with the ratio of traders long to short at 2.16 to 1. Traders have remained net-long since Jun 07 when USD/CAD was trading near 1.34474. The number of traders net-long is 7.6% higher than yesterday and 0.8% lower from last week, while the number of traders net-short is 15.7% lower than yesterday and 22.3% higher from last week. When sentiment is read as a contrarian indicator, this positive value suggests a bearish bias for the currency pair.

TfKjBx

Chart 3: USDCAD Client Positioning


ACY, the Best Choice for Global Investors
We can Improve your Trading!

For the details, please visit our website www.acy.com
or Facebook at https://www.facebook.com/acy.capital/
 
AUD Respects Support, Rally Back to Ascending Channel - 26 June, ACY Team

The Australian dollar halted the short-term descending momentum for four consecutive days, and rallied 0.35 percent to $0.75650 against the U.S. dollar. It’s currently rising with following an ascending channel, depicted as chart 1, started from early May where the reversal occurred.
In a background of decreased real wages in the first quarter and the developed world’s highest debt-to-GDP ratio, consumers are reducing their cash for a rainy day, in which their savings levels have more than halved in five years. The rising cost of living intensifies the squeeze, with news that electricity prices are climbing as much as 20 percent in New South Wales next month.
As consumption accounts for more than half of gross domestic product, the highly indebted can be more sensitive to declines in income, which hence has negative impacts on consumer spending.
According to BIS (Bank of International Settlement), Australia’s household debt to GDP ratio has jumped almost 15 percent points in four years, reaching as high as 123.1 percent in 2016 just after that of Switzerland. As the central bankers’ bank, BIS said that the higher speed of debt than GDP growth over prolonged periods is a “robust early warning” signal of financial stress, while rising household debt boosts short-term consumption.

qDZF3n

Chart 1: Developed countries’ household debt to GDP

There is a problem in Australia that the record-low interest rates allow buyers to borrow large amounts of money, which would boost household debt further and continue to push real estate market, especially in Sydney and Melbourne which attract enormous investment from Chinese buyers.
Regarding worries over high level of debt from policy makers, the bank regulator is prompted to enforce measures to rein in riskier mortgages and strengthen lending standards, when the RBA (the Reserve Bank of Australia) noted in April that a third of mortgage holders had either no buffer or not enough of one to cover a month’s repayment. The borrowers with high risks tend to hold newer loans or come from lower-income and lower-wealth households.
Aussie dollar climbed 0.28 percent to US$0.75813 as of 12:50 p.m. in Sydney. Technically with the bullish Relative Strength Index of 58.3327, the AUD/USD is consolidating in a developing ascending price channel. With a sign of rising tendency, it likely continues to rally and move in this price channel. In the event that the AUD/USD edges higher, traders should first watch for the pair breakout above Jun 14th’s high of 0.76354. Alternatively if prices reverse lower, the AUD/USD must first break beneath the lower channel line, then test last Friday’s low of 0.75361.

pwKCnU

Chart 2: AUDUSD Daily


ACY, the Best Choice for Global Investors
We can Improve your Trading!

For the details, please visit our website www.acy.com
or Facebook at https://www.facebook.com/acy.capital/
 
Euro Slides After Draghi Comments, Investors Await Yellen Speech - 27 June, ACY Team

The euro hit the weekly highs to $1.12187 against the U.S. dollar, but later retraced its gains, by 0.15 percent to $1.11809 on Monday after the European Central Bank chief Mario Draghi defended the ECB’s easy monetary policy, and as investors are waiting for Federal Reserve Chair Janet Yellen’s speech on Tuesday.
Draghi, who gave a speech to university students in Lisbon, noted that super low rates create jobs, boost economic growth and benefit borrowers, ultimately easing inequality. He also rejected calls to exit ultra easy monetary policy quickly, by arguing that premature tightening would lead to a new recession and more inequality.
German businesses, as a dominant factor of European market, were feeling more positive than ever this month, according to a closely-watched business survey, which unexpectedly improved in the latest sign of confidence in Europe’s economic recovery.
The Institute for Economic Research (Ifo’s) overall business climate index had already hit a record high last month, and June’s survey saw the index rise from 114.6 to 115.1, in contrast to predictions that it would ease slightly. Ifo’s two sub-indices which measure expectations and current assessment beat forecasts, increasing to 106.8 and 124.1 respectively.
Euro zone’s economy would be positive as Germany’s economy is already in rude health, with unemployment at a record low and economic expansion of 0.6 per cent in the first quarter, and also experts are expecting the growth to continue.
Fed Chair Yellen is set to deliver a speech in Europe on Tuesday, with investors’ expectation that she will maintain a positive outlook on the U.S. economy in spite of a recent batch of weak economic data, which hence is supporting the Fed’s forecast of raising interest rates once more this year and three times next year.
The rate hike expectation helps improve the performance of the dollar against a basket of major currencies. With a reason that it already fuels enormous energy into the dollar, the long-term outlook of this strong performance may not be sustainable.
The EUR/USD climbed 0.1 percent to $1.11910 as of 3:30 p.m. in Sydney. Technically with a sign of relatively strong Relative Strength Index (RSI) of 54.6686, the euro is consolidating in a daily developing ascending channel. This cannel as depicted below, has been created by connecting a series of swing highs and lows beginning with last Tuesday’s price action.
In the event that the EUR/USD breaks lower, traders should first watch for the pair to breakout beneath 5-day moving average of 1.11763. Alternatively if prices continue to edge higher, the euro must first break above Monday’s high of 1.12187, then test the ascending channel line near 1.12259.


b4AhrH

Chart 1: EURUSD Daily


ACY, the Best Choice for Global Investors
We can Improve your Trading!

For the details, please visit our website www.acy.com
or Facebook at https://www.facebook.com/acy.capital/
 
US30 Declined Amid Yellen’s Speech - 28 June, ACY Team

The U.S. 30 (underlying Dow Jones Industrial Average) lost around 0.45 percent of its value to the two-week lows of 21309.1 even though U.S. Federal Reserve Chair Janet Yellen said on Tuesday that she does not believe that another financial crisis will occur at least as long as she lives, mainly due to reforms of the banking system since the 2007-09 crash.
For a summary, the NYSE was lower at the close on Tuesday, with Dow Jones Industrial Average falling 0.46 percent, while the S&P 500 down 0.81 percent, and the NASDAQ Composite index declining 1.61 percent.
The biggest gainers of the session on the U.S. 30 were JPMorgan Chase & Co (NYSE:JPM), which rose 0.93 percent or 0.81 points to close at 88.05. Wal-Mart Stores Inc (NYSE:WMT) gained 0.68 percent or 0.51 points to end at 76.01 and Home Depot Inc (NYSE:HD) was up 0.54 percent or 0.82 points to 152.24 in late trade.
The loss of the index was largely propelled by losses in Technology and Communication Service sectors. The biggest losers included Verizon Communications Inc (NYSE:VZ), lost 1.99 percent or 0.91 points to end at 44.84, while Microsoft Corporation (NASDAQ:MSFT) declined 1.87 percent or 1.32 points to 69.21 and Cisco Systems Inc (NASDAQ:CSCO) shed 1.49 percent or 0.48 points to close at 31.76.
Fed’s chair Yellen gave no indication her plans for continued tight monetary policy had shifted while acknowledging that some asset prices had become pretty high. “We’ve made very clear that we think it will be appropriate to attainment of our goals to raise interest rates very gradually,” she said this time in London.
However, the general loss of U.S. equity market was largely influenced by her speech, as the rate hike plan seems in a rush, an opinion from Neel Kashkari, Minneapolis Fed President. With inflation low and wages showing little sign of an upward surge, the U.S. Reserve action on raising interest rates may be inappropriate to current economy which has no sign of overheat.
"Why are we trying to cool down the economy, when there may still be some slack in the job market, and there is still some room to run on the inflation front?" he said. "We're not seeing wages climb very fast, and we're not seeing inflation. That tells me the economy is not on the verge of overheating."
Technically intraday trading is at 21322.6 as of 2:50 p.m. in Sydney, and retracing its gains to 20-day moving average, which generally is seen as a support level by investors. As it is gathering a descending momentum in the near term from the record high, a downside may not shift if breakout of MA20 occurs.


Nb394g

Chart 1: US30USD Daily


ACY, the Best Choice for Global Investors
We can Improve your Trading!

For the details, please visit our website www.acy.com
or Facebook at https://www.facebook.com/acy.capital/
 
Crude Rose For a Fifth Straight Day as U.S. Inventories Drop - - 29 June, ACY Team

Crude rebounded for a fifth straight day and recovered all losses from last week. It surged on Wednesday 2.76 percent or $1.23 per barrel, to end at $44.694 as concern over a supply glut eases.
Oil slumped into a bear market last week on concerns that physical oversupply and increases in U.S. inventories would undermine a deal of output cuts from the OPEC (Organization of Petroleum Exporting Countries). A data from the Energy Information Administration showed that U.S. crude inventories remain more than 100 million barrels above the five-year seasonal average, which drove oil prices down.
According to the EIA, inventories that remained stubbornly high dropped 894,000 barrels last week, with Oklahoma inventories (the largest delivery stock in US) falling for the sixth straight week, while U.S. crude oil stockpiles rose by 118,000 barrels, the amount of oil held at the Cushing hub fell for the sixth week in a row. Declined U.S. gasoline stockpiles boosted futures (5.5 percent) over the past five sessions on Wednesday.
“The positioning clearly says there is room for a fairly abrupt reversal,” said Mike Wittner, head of oil market research at Societe Generale SA, adding that this will depend on signs the market is re-balancing. “The gross short positions are very big. Sentiment is overwhelmingly bearish right now, but things can turn around in a hurry.”
Technically in the near term oil prices is moving in a descending price channel, which is depicted in blue below. After touching a support level of the lower channel line the price got a sharp bounce and now is testing the 20-day moving average, which is seen as a key resistance. In the event of crude prices edge higher to break the MA20, there is a large room for traders to see further increases towards MA60. Alternatively if prices reverse lower impeded by the MA20, it will decline further to test Jun 21st’s low of 41.822.
If we see the longer term’s outlook, it is still staying in an upper upward price channel after finding a median line support. A brighter future can be seen if it is not breaking lower to this support line with rising Relative Strength Index (RSI) which is now standing around at median level.


2K9MbR

Chart 1: WTICOUSD Daily


ACY, the Best Choice for Global Investors
We can Improve your Trading!

For the details, please visit our website www.acy.com
or Facebook at https://www.facebook.com/acy.capital/
 
Yen Jumps to Session High as BOJ Kept Current Easing Framework - 30 June, ACY Team


The yen bounces back strongly for a third straight day to partly erase the weekly loss against the U.S. dollar. The intraday price of USD.JPY slumps 0.35 percent or 0.387 points to ¥111.785 yen as of 12:20 p.m. in Sydney largely for the reason that the U.S. dollar suffers a massive drop in these days.
The dollar remains its defensive steps compared with nine of its G-10 peers as their central banks are considering to start following the Federal Reserve in shifting higher interest rates and then the financial market promptly recalibrates position.
The USD’s tumble was mainly driven by a hawkish voice of both the ECB’s President Mario Draghi and BOE’s Governor Mark Carney. Just a week after saying that near-zero interest rates were appropriate, Carney suggested the time is nearing for an increase on Wednesday’s speech. Meanwhile, his Euro-zone counterpart Draghi noted that euro-zone’s economy is on the way to recovery after a decade of easy money policy and his speech had been interpreted as signalling an imminent change in current ultra-loose monetary policy. However, the Fed’s chair Janet Yellen showed a dovish voice though her policy tightening is still on track.
“The market is very sensitive to the idea that a number of central banks are appropriately and belatedly reassessing the need for emergency policy accommodation,” said Alan Ruskin, co-head of foreign exchange research at Deutsche Bank AG.
Unlike his counterparts who are set to keep the foot on the pedal of monetary stimulus, the Bank of Japan governor Haruhiko Kuroda highlighted Japanese economy continues to strengthen, but inflation is still weak, which is far away from its 2 percent target and wages and investment remain subdued. The BOJ has pushed central-bank activism further than its peer, with having an active control of the yield curve by buying massive bond for more than four years.
Recent data of Japan shows a positive outlook for its economic growth, with both changes in Overall Household Spending and Industrial Production last month were beating their forecasts and previous statistics, at -0.1 percent and 6.8 percent respectively. However, National CPI in May remained unchanged compared with previous at 0.4 percent, and unemployment rate even rose to 3.1 percent.
Technically for the long-term period, the USD/JPY remains consolidated in a daily descending price channel after touching a key resistance found at the upper channel line with the Relative Strength Index (RSI) sharply decreasing. In the event of successful breakout of the resistance, the U.S. dollar tends to rise further following the upward channel depicted in red according to chart 1.


cp7fWb

Chart 1: USDJPY Daily

If we try to predict the future movement of the USD/JPY through an indicator of Fibonacci retracement, 112.239 (61.8% retracement) is seen as a key resistance which impeded its further increase. If it breaks higher to 61.8% retracement, it more likely moves towards 114.364 (100% retracement). Alternatively if it reverses lower, 111.578 (50% retracement) can be seen as a support level for the price.


Cq988Y

Chart 2: USDJPY Daily – Fibonacci


ACY, the Best Choice for Global Investors
We can Improve your Trading!

For the details, please visit our website www.acy.com
or Facebook at https://www.facebook.com/acy.capital/
 
Crude Jumps With U.S. Stockpile’s Decline – 26 July, ACY Team

Crude surged on Tuesday to break to the July 20th’s highs, reaching to the top since June at 48.485. It jumped nearly 4.57 percent back to $48 per barrel as OPEC moved on Monday to cap Nigerian oil output and called on several members to boost compliance with production cuts, which aim to help clear excessive global stocks and support flagging prices.
OPEC has agreed with several non-OPEC producers led by Russia to cut oil output by a combined 1.8 million barrels per day (bpd) from January 2017 until the end of March 2018, stating Libya and Nigeria were exempted from the limits to help their oil industries recover from years of unrest.
The deal to curb output propelled crude prices above $58 a barrel in January but they have since slipped back to a $45 to $50 range as the effort to drain global inventories has taken longer than expected.
Oil futures traded as much as 5 percent higher, extending its session’s gains, while a report released by American Petroleum Institute on Tuesday revealed crude inventories declined by 10.2 million barrels last week. That would be the largest shrink since September if Energy Information Administration data confirms the decline on Wednesday.
Although oil surges recently, some lingering doubts over the pace of the oil market rebalancing still exist, with increasing oil supplies from the U.S., Libya and Nigeria threatening to hinder curbs by members of the Organization of Petroleum Exporting Countries and its allies. Saudi Arabia is less likely to act alone to balance the market and other nations should improve their implementation of supply cuts.
For fundamentals, investors should be more focusing on tomorrow’s Fed Interest Rate Decision which has a forecast of 1.25 percent, matching the former figure. If the U.S. interest rate remains unchanged, there is no much impacts on oil prices.
Technically it is now touching the upper level of descending price channel, with facing a great resistance. If it successfully breaks to it, traders may see a further increase in the short term; otherwise, it will reverse lower and continue to follow the price channel in the middle term.
When we see the longer term outlook of oil prices, it is currently standing far away from the median line which is considered as a support level. In the event of crude prices are falling back, the median line will be seen as a support in the long term.

9772119_20170726010828.png

Chart 1: WTICOUSD Daily

aUmMuw

Chart 2: WTICOUSD Daily (2)


ACY, the Best Choice for Global Investors
We can Improve your Trading!

For the details, please visit our website www.acy.com
or Facebook at https://www.facebook.com/acy.capital/
 
Dow Hits Record Amid Fed’s Dovish Statement – 28 July, ACY Team

Thursday the U.S. 30 (underlying Dow Jones Industrial Average) gained 0.49 percent or 106.7 points to close at 21775.8, hitting new record after FOMC statement noted that it seems the doves are back in charge at the Fed yesterday. Any chance of a September rate hike seems to have disappeared with not-as-good-as-expected Consumer Price Index (CPI).
Under the view of realized and expected labor market conditions and inflation, the Committee decided to maintain its existing policy of reinvesting principal payments from its holdings of agency debt and agency mortgage-backed securities in agency mortgage-backed securities and of rolling over maturing Treasury securities at auction. It also keeps the target range for the federal funds rate at 1 to 1-1/4 percent. The stance of monetary policy remains accommodative, thereby supporting some further strengthening in labor market conditions and a sustained return to 2 percent inflation.
The biggest gainers of the session on the U.S. 30 were Verizon Communications Inc (NYSE:VZ), which rose 7.68 percent or 3.41 points to close at 47.81. Boeing Co (NYSE:BA) gained 3.23 percent or 7.55 points to end at 241.00 and Merck & Company Inc (NYSE:MRK) was up 3.06 percent or 1.89 points to 63.69 in late trade.
The loss of the index was largely propelled by losses in Technology sectors. The biggest losers included Apple Inc (NYSE:AAPL), lost 1.89 percent or 2.90 points to end at 150.56, while American Express Company (NYSE:AXP) declined 1.70 percent or 1.45 points to 83.85 and Visa Inc (NYSE:V) shed 1.27 percent or 1.28 points to close at 99.57.
The U.S. Department of Labor released Initial and Continuing Jobless Claims on Thursday, showing that the labor market’s performance is not as good as expected, which likely dragged the U.S. dollar in the near term. While the Durable Goods Orders are far exceeded the forecast, set to be 6.5 percent which is more than double of the expectation figure. The U.S. international trade status strengthened, with Goods Trade Balance showing a reduction in trade deficit.
However, intraday trading is retreating from the record, at 21734.1 as of 11:50 a.m. in Sydney, partly erasing yesterday’s gains. Technically with a sign of relatively strong Relative Strength Index (RSI) of 64.3999, it is still in an ascending trend. When we analyse by Fibonacci retracement, if the index breaks higher to 21779.1 (100% retracement), traders may look for some spaces for further rise before a key resistance found at 22074.4 (123.6% retracement).
Future movement in the near term may be highly influenced by its Gross Domestic Product (GDP) released later today.


20287039_1968708630072470_642020154287443473_o.png

Chart 1: US30 Daily


ACY, the Best Choice for Global Investors
We can Improve your Trading!

For the details, please visit our website www.acy.com
or Facebook at https://www.facebook.com/acy.capital/
 
Looine Dropped as US Jobs Boost USD – 7 August, ACY Team

The loonie continued to lose its value for a fifth straight day on Friday from the high record since the July of 2015, and fell 1.7 percent against the U.S. dollar last week but is still up nearly 9 percent since early May.
With some positive signs that U.S. employers hired more workers than expected in July and raised their wages, the greenback rallied against a basket of major currencies last week. Rise in hiring data in July along with stronger household incomes and buoyant consumer confidence may put another plan of raising interest rates later this year conducted by the Federal Reserve into schedule as it seeks to normalize monetary policy.
Additionally good performance of change in non-farm payrolls which was beating the forecast propelled the recent growth. Although the corrective bounce in the U.S. dollar is happening, markets still show questioned about its long-term growth as President Donald Trump’s policy agenda has run aground.
The value decline of loonie can be seen as a corrective rally in the U.S. dollar, pushed mostly from the greenback side in relation to the U.S. jobs data. Jobs data showed that Canadian labor market starts to tighten, as Canada's economy added 10,900 jobs in July, mostly in full-time employment, Statistics Canada said, while the jobless rate fell to its lowest since October 2008.
The currency's strongest level of the session was C$1.24332, while it touched its weakest since July 18 at C$1.2667. Helped by the Bank of Canada raising interest rates last month for the first time in nearly seven years, the loonie surged more than 9 percent since early May.
Oil prices are one of Canada’s major exports and are playing an important role in its GDP, rising on Friday but were down on the week, pressured by rising OPEC exports and strong U.S. output.
The USD/CAD declined slightly by nearly 0.1 percent to C$1.26342 as of 12:05 p.m. in Sydney. Technically with a sign of rising Relative Strength Index (RSI) of 44.8623, the USD/CAD is consolidating in a daily developing ascending channel. It may cease to rise after touching a key resistance found at a descending 20-day moving average.
In the event that the USD/CAD breaks lower propelled by MA5, traders should first watch for the pair to decline further. Alternatively if prices continue to edge higher, the USD/CAD must first break above Friday’s high of 1.26674, then test the ascending channel line near 1.26815.
When we analyse by Fibonacci retracement, 1.27370 (23.6% retracement) could be seen as another resistance if the pair continues to rise.


20690322_1973327092943957_1626606481059475686_o.png

Chart 1: USDCAD Daily


ACY, the Best Choice for Global Investors
We can Improve your Trading!

For more information, please visit us on www.acy.com
Or Facebook https://www.facebook.com/acy.capital/
 
Gold Kept Rising Despite a Weakening Fear on North Korea[/I][/I]
Gold prices held on to their recent haven-driven gains last week with the precious metal up 2.3 percent to trade at 1287 ahead of the New York close on Friday, despite efforts from U.S. officials to tamp down fears of imminent nuclear war with North Korea. It hit tops on Friday since Jun. 8th, closed by 0.19 percent at $1288.11, while with some intraday volatilities.
The advance continues amid growing geopolitical tensions between the U.S. and North Korea with more hawkish voice on nuclear war by North Korean leader Kim Jong-Un. Nevertheless, two top U.S. national security officials sought to lower fears of this geopolitical risk by preparing to meet with South Korea’s leader. In a call with Trump on Saturday in Asia, Chinese President Xi Jinping called for all sides to maintain restraint and avoid inflammatory comments.
The latest reading on consumer price index in U.S. showed a below-forecast rise, lowering the possibilities for the central bank to stay on its tightening course for one more rate hike this year. The less-than-expected CPI has boosted gains on gold prices, continuing to drive investors out of investing U.S. dollar, and attracting them in the gold market instead.
The Consumer Price Index rose 0.1 percent seasonally adjusted; rising 1.7 percent over the last 12 months, not seasonally adjusted, a Labor Department report showed Friday. More specially, the index for shelter, medical care and food rose in July, leading to the overall increase. The index for natural gas declined, while the electricity index rose and the gasoline index was unchanged.
Highlighting the economic data this week will be the July retail sales and the release of the minutes from the latest FOMC policy meeting. Weakening price index dragged the expectation for a December rate-hike to just a 30 percent chance that the central bank will deliver on its promise for a final 25bps hike this year. There is a general expectation that coming with falling interest rate expectation, rising geo-political tensions, along with weakness in broader risk assets weighting on sentiment, gold is likely to remain well-supported in the medium term.
Technically gold prices have signs to slow down its increase in face of a key resistance above found at Jun 6th’s highs of 1296.06, with an intraday trading at 1287.72 as of 12:16 pm in Sydney. In this spot, investors should keep a close eye on next few days’ performance. If it is successfully breaking to the resistance, a bullish market for gold prices could be seen in the near term; otherwise, it likely retreats to find near support at May 9th’s low of 1214.25.

20746147_1976444382632228_2988178622635029783_o.png


Chart 1: XAUUSD Daily
A closer look at price action in 240-min chart shows prices attempt to approach the upper channel line, keeping gold within the ascending channel formation that we’ve tracking for weeks now. Any breakout of this channel will likely lead to a changing pattern afterwards.

20861726_1976444545965545_2619354543740467303_o.png


Chart 2: XAUUSD 240-min
 
Japanese Yen Dropped 1.3 Percent to Four Months Lowest

On Monday, Japan’s GDP came in at 4.0 percent which is much higher than forecasted 2.5 percent, making it the strongest growth in more than two years since the first quarter of 2015. The solid GDP data has shown signs of improvement of the Japanese economy, investor, the Nikkei 225 gained 0.9 percent intraday closed at 19590.0 while opening at 19405.0 on Monday.

The Japanese Yen was one of the winner in last week’s over North Korea crisis, as investors sought after safe-haven assets such as Yen and Gold because of the tightening tension between U.S. and North Korea. JPY has dropped 1.3 percent last week to 108.74, lowest since April

However, the concern over tensions between the U.S. and North Korea seems eased for now, after President Trump keeps quite on Monday, and North Korea signalled that it would delay plans to fire a missile near Guam.
The New York Fed President William Dudley’s hawkish statement about another interest rate hike this year also helped lifted the greenback, which made a slight change to JPY Monday.

Spot Gold price pulled back 0.5 percent on Monday after rising for four consecutive days, traded at 1281.33ounce. As of writing, gold is trading at 1274.49 per ounce, which have broken the key resistance of 1290 and 1280.
From chart 1, investors will need to be cautious on support level of 1270, because of the unpredictable situation between the U.S. and North Korea, and the upcoming US Fed Meeting, spot Gold is believed still have the chance to advance. In the meantime, 1282 is another key resistance which investors should keep a close eye in the next few days.

20748340_1976986945911305_6080734698675945810_o.png
 
Pound Extended Losses With a Weaker-Than-Estimated CPI

The pound extended losses and fell to the monthly lowest against the U.S. dollar after UK’s CPI released on Tuesday showed inflation is weaker than forecast, slowing down the path on interest rate hike by the Bank of England. Hence reduced expectations of tighter policy dragged the pound these days.

Sterling was down for a second day, mainly influenced by its July inflation rate of 2.6 precent rise, the same pace as in June and missing market expectations of a 2.7 percent gain. While core inflation, which excludes volatile food and energy prices, remains unchanged at 2.4 percent, also below the expected.

More specifically, prices for housing, electricity, gas and other fuels rose 2.2 percent from 2 percent in June; food and non-alcoholic beverages jumped 2.6 percent from 2.3 percent; clothing and footwear increased 3.2 percent from 2.3 percent. While cost of transport, recreation and culture, and restaurants and hotels went up at a slower pace.
Despite CPI inflation growth held steady last month, prices are still rising well ahead of average wages, which means the speed-up inflation is squeezing on most peoples’ living standard. For example, commuters, as well as loan lenders, are set to bear the brunt of soaring costs linked to retail-price increases. However, pensioners will benefit most because their payments are based on the retail index.

U.S. retail sales rose by 0.6 percent, recording their biggest increase in seven months in July as sales on motor vehicles surged and consumers’ discretionary spending rose. It’s suggesting the economy continued to gain momentum early in the third quarter, and also boosting U.S. dollar.

The GBP/USD rose slightly by nearly 0.07 percent to $1.28690 as of 2:10 p.m. in Sydney. Technically even though with a sign of weak Relative Strength Index (RSI) of 38.9348, the GBP/USD is consolidating in a daily developing ascending channel in the medium term. It may cease to decline after touching a key support found at a lower channel line.

In the event that the GBP/USD breaks out the channel line, traders should first watch for the pair to decline further and look for another support at Jun 21st’s low. Alternatively if prices continue to reverse higher, the GBP/USD will test 20-day moving average.

20863610_1977349852541681_3844363104898198707_o.png


Chart 1: GBPUSD Daily
A glance in a longer term of weekly chart shows it’s now struggling to break out 1.29461 (23.6% retracement), which could be seen as an obstacle for further increase. If it fails to retreat, investors could see a long-buy before 1.37621 (38.2% retracement).

20819427_1977349915875008_5343795570876441286_o.png


Chart 2: GBPUSD Weekly
 
Crude Rises to 12-Week High Amid Tighter Supplies

The U.S. West Texas Intermediate crude September contract settled sharply higher on Friday, jumping about $1.8, or 3.84 percent to end at $48.654 a barrel. Despite its Friday’s rally, oil prices fell last week on signs that reports of weak Chinese demand deflated the market, but a rather bullish EIA report, a weaker dollar and a falling rig count provided some lifts.

Oil rose to the highest since late May amid tightening supplies and a broader market’s rally sparked by Steve Bannon’s departure from the White House. Government data earlier last week demonstrated that the stockpiles dropped the most since September last week, while U.S. crude production had the biggest weekly rise since June.

The removal of Bannon, the former chairman of Breitbart News, may calm the waters on Trump’s remarks on violence in Charlottesville, Virginia, which led to sustained questions about his ability to retain his team and implement his economic plans and U.S. energy strategy effectively.

A report updated by oilfield services firm Baker Hughes Friday morning, shows its weekly count of oil rigs operating in the U.S. last week fell by five rigs to a total of 763. A unit at Exxon (NYSE:XOM) Mobil’s Baytown, providing 584,000 barrel-a-day, the second largest refinery in the U.S., has been shut down. The reduced rigs are an important barometer for the drilling industry and serves as a proxy for decreased oil production supply.

Oil prices has lingered below $50 a barrel as the OPEC (Organization of Petroleum Exporting Countries) and its allies make efforts to cut supplies and help rebalance the market. Besides members in OPEC, 10 more producers outside the cartel, including Russia, agreed a deal to slash 1.8 million barrels per day in supply until March 2018.

In the week ahead, investors will keep a close eye on the weekly data on oil and gasoline stockpiles released by the U.S. Energy Information Administration.

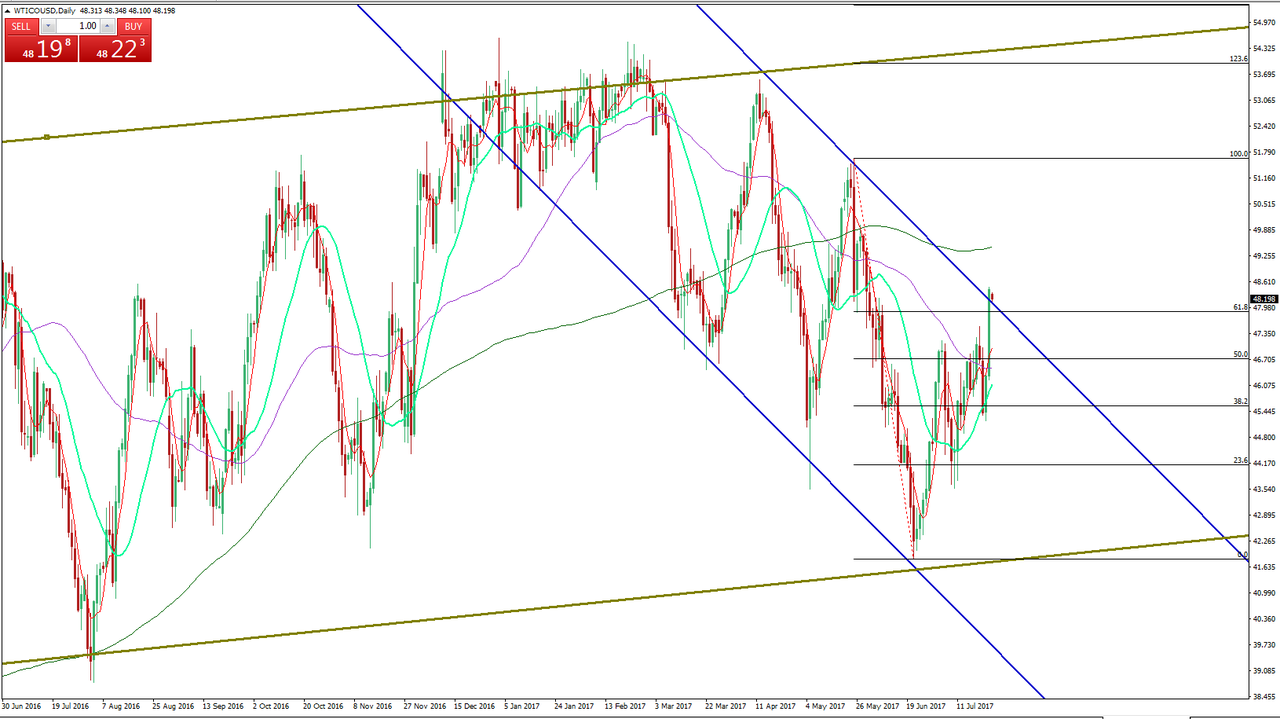
Price of crude oil is currently trading slightly lower at 48.535 as of 12:16 p.m. in Sydney. With bullish signs that the Relative Strength Index (RSI 14) has been in a rise tendency at 53.9695, its price broke higher to a descending price channel, which was supposed to be a price formation in the last few months, after retreating from the breakout earlier this month. The second breakout is more likely to lead to further rise afterwards, but will face a resistance found at 50.271.

21015946_1979555102321156_67165281835086178_o.png


Chart 1: WTICOUSD Daily
 
Back
Top